Seabornのプロットでマーカーの色を変える
最近、Seabornでプロットをすることが増えたのですが、デフォルトだと色味がパッとしなかったり、サブプロットしたら全部同じ色になったりして困ったので、色を変える方法を調べてみました。
サマリ
- seaborn.scatterplotのpaletteにパレット名を指定することで、色の系列を変えることができる。
- 単色の場合は、seaborn.scatterplotのcolorにmatplotlibのnamed colorsの色名を渡すことで色を変えることができる。
前提
seabornのバージョン:'0.10.0'
seaborn.scatterplotは以下のドキュメントを参照(ただし、リンクは最新のバージョン)。
seaborn.pydata.org
散布図の色を変えてみる。
データのロード
今回は、ペンギンデータセットを使います。
github.com
penguins = pd.read_csv("https://github.com/allisonhorst/palmerpenguins/raw/5b5891f01b52ae26ad8cb9755ec93672f49328a8/data/penguins_size.csv")
penguins.head()

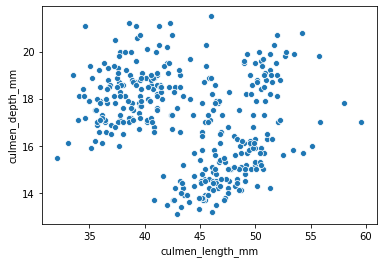
単純にscatterplotで散布図を書くとこのようになります。
hueを使う場合
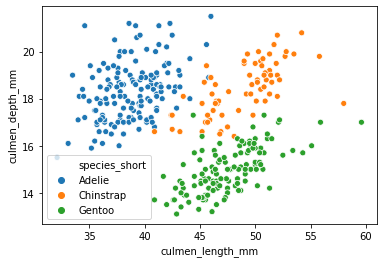
ご存知の通り、hueを使うことで、あるカテゴリで層別し、色を変えてプロットすることができます。
ペンギンの場合は、種類を表すspecies_shortの値が{'Adelie', 'Chinstrap', 'Gentoo'}のどれかなので、これをhueに指定しましょう。
sns.scatterplot(data=penguins, x="culmen_length_mm", y="culmen_depth_mm", hue="species_short")
paletteにpaletteの名前を指定することで、色味を変えることができます。パステルカラーにしてみましょう。
sns.scatterplot(data=penguins, x="culmen_length_mm", y="culmen_depth_mm", hue="species_short", palette="Pastel1")
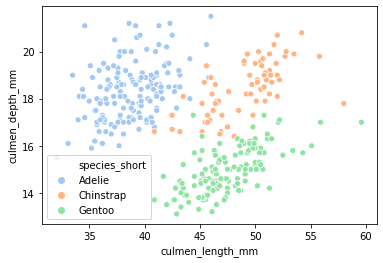
パレットの文字列の一覧は、こちらの記事を参考にできます。少々乱暴ですが、エラーを起こして指定できる文字列を吐き出させています。
medium.com
サブプロットなどで層別ごとに個別にグラフを書く場合
さて、先ほどはhueを指定することで一つのグラフに3種のデータを描画しました。しかし、色が違うものの、点の分布が混ざっていて少々見にくいです。そう言う場合は、subplotを使って、species_shortごとに異なるデータとして散布図を描くことになるかもしれません。
fig, axs = plt.subplots(1, 3, sharey=True)

#'Adelie', 'Chinstrap', 'Gentoo'
g_Adelie = sns.scatterplot(data=penguins[penguins["species_short"] == "Adelie"], x="culmen_length_mm", y="culmen_depth_mm", ax=axs[0])
g_Adelie.set_title("Adelie")
g_Adelie.set(xlim=(30, 60))
g_Adelie.set(ylim=(13, 22))

g_Chinstrap = sns.scatterplot(data=penguins[penguins["species_short"] == "Chinstrap"], x="culmen_length_mm", y="culmen_depth_mm", ax=axs[1])
g_Chinstrap.set_title("Chinstrap")
g_Chinstrap.set(xlim=(30, 60))
g_Chinstrap.set(ylim=(13, 22))

g_Gentoo = sns.scatterplot(data=penguins[penguins["species_short"] == "Gentoo"], x="culmen_length_mm", y="culmen_depth_mm", ax=axs[2])
g_Gentoo.set_title("Gentoo")
g_Gentoo.set(xlim=(30, 60))
g_Gentoo.set(ylim=(13, 22))
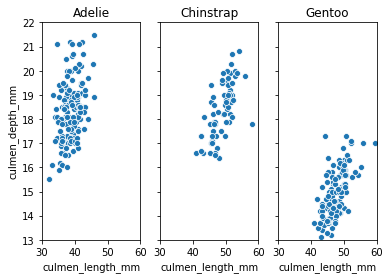
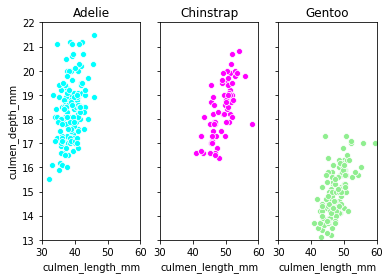
さて、無事に描くことができましたが、見ての通り、色が同じなので視覚的にパッとしません。
色を変えたい場合は、colorにmatplotlibのnamed colorsの色名を渡すことで色を変えることができます。
matplotlib.org
fig, axs = plt.subplots(1, 3, sharey=True)

#'Adelie', 'Chinstrap', 'Gentoo'
g_Adelie = sns.scatterplot(data=penguins[penguins["species_short"] == "Adelie"], x="culmen_length_mm", y="culmen_depth_mm", color="aqua", ax=axs[0])
g_Adelie.set_title("Adelie")
g_Adelie.set(xlim=(30, 60))
g_Adelie.set(ylim=(13, 22))

g_Chinstrap = sns.scatterplot(data=penguins[penguins["species_short"] == "Chinstrap"], x="culmen_length_mm", y="culmen_depth_mm", color="fuchsia", ax=axs[1])
g_Chinstrap.set_title("Chinstrap")
g_Chinstrap.set(xlim=(30, 60))
g_Chinstrap.set(ylim=(13, 22))

g_Gentoo = sns.scatterplot(data=penguins[penguins["species_short"] == "Gentoo"], x="culmen_length_mm", y="culmen_depth_mm", color="lightgreen", ax=axs[2])
g_Gentoo.set_title("Gentoo")
g_Gentoo.set(xlim=(30, 60))
g_Gentoo.set(ylim=(13, 22))
